Answer Summary
Payer contract cycles often drag to 153 days due to passive “dead air” follow-up gaps and over-reliance on low-response payer portals. By implementing a strict 14-day “Pulse Check” cadence and shifting to direct email communication, DME providers can achieve a 15% reduction in cycle time and significantly lower their 2026 Days Sales Outstanding (DSO). Transforming contracting from an administrative task into an active pursuit of revenue ensures that open locations become billable entities rather than financial liabilities.
The Scenario: The “Pending” Purgatory
For any healthcare organization, a “Pending” contract is a liability. It represents a location that is open, staffed, and incurring costs, but unable to bill commercial insurance. Every day a contract sits in limbo is a day of lost revenue.
When WWS conducted a deep-dive audit of a multi-state provider group’s contracting lifecycle, the data was alarming. The average cycle time—from the moment a contracting request was made to the moment ink hit the paper—was 153 days.
Even more concerning was the variability. Some contracts closed in a day; others dragged on for 730 days. The process had no predictability, making financial forecasting impossible for the CFO.
The Operational Failure
Why was it taking five months to sign a standard agreement? We looked at the activity logs to find the friction points.
1. The “Dead Air” Problem
The audit revealed that the average time between follow-ups was 21 days. This means that after sending an email or leaving a voicemail, the credentialing specialist would wait three full weeks before touching the file again. In the world of payer contracting, 21 days is enough time for your application to be archived, lost, or assigned to a new rep who has no context of the previous conversation. Momentum was dying in these long gaps.
2. The Portal Mirage
The team was heavily relying on payer portals to check statuses. While this felt “official,” our data showed it was ineffective. Portal messages yielded only a 15% response rate10. The team was shouting into a digital void and calling it “work.”
3. The Low Success Rate
The result of this passive approach was a dismal success rate. Only 22% of initiated applications resulted in a successful contract. The majority (35%) were eventually rejected or closed due to lack of response or missed deadlines.
The WWS Solution: The “Pulse Check” Protocol
To cut the cycle time, we had to increase the heartbeat of the operation. WWS implemented a standardized “Pulse Check” Protocol.
1. The 14-Day Cadence
We scrapped the casual “check when you can” approach. We mandated a strict follow-up interval of 14 to 21 days. If an application hasn’t moved in two weeks, it triggers an automatic alert for action. This ensures that a payer rep never has enough time to “forget” the file.
2. The Channel Pivot
We shifted the primary communication channel from Portals to Email. Our analysis showed that direct email follow-ups had a 50% response rate—more than triple that of portal messages. We trained the team to hunt for human email addresses (Contract Managers, Network Directors) rather than relying on generic “Contact Us” forms.
3. The Triage System
We noticed that 43% of applications were stuck in “Pending” status. To clear this backlog, we implemented a triage system. We separated “High Complexity” payers (like BCBS) from “Standard” payers. High-complexity files were assigned to senior staff with specific experience in navigating those organizations, preventing them from getting stuck in the queue.
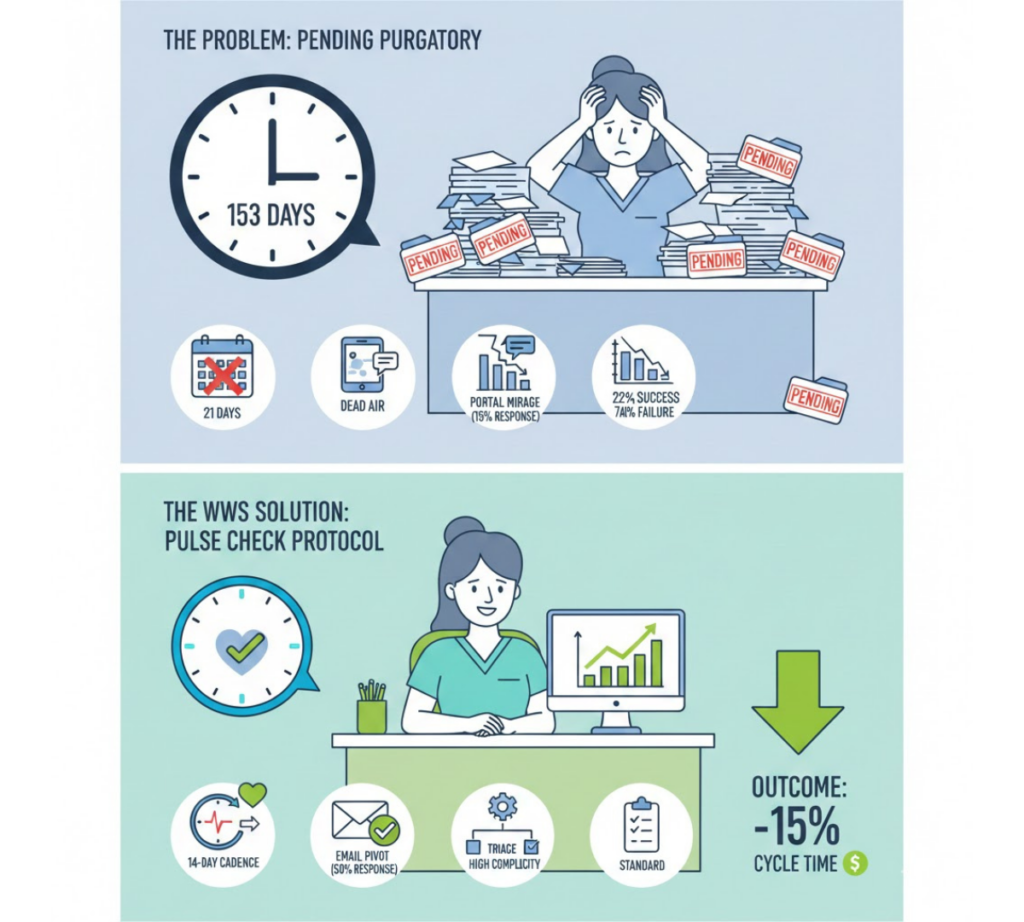
The Outcome
Speed is a choice. By enforcing a tighter cadence and choosing more effective communication channels, WWS set a target to reduce the average cycle time by 15% within the first 12 months. More importantly, we transformed “Contracting” from a passive administrative task into an active pursuit of revenue.